Observability with Spring Boot 2

Note: This post assumes basic familiarity with Spring Boot and Google Cloud Platform. Detailed configuration and setup instructions can be found in the official documentation for each respective technology.
In today’s fast-paced and complex software environments, having a deep understanding of how your applications behave and perform in production is crucial. Observability plays a vital role in gaining visibility into the inner workings of your applications, enabling you to identify and resolve issues quickly. In this post, we’ll explore how to achieve observability in your Spring Boot 2 applications using Micrometer and integrate this with Google Cloud’s operations suite.
Understanding Observability
Observability refers to the ability to understand the internal state of a system based on its external outputs. It involves collecting, analyzing, and visualizing various metrics, logs and traces. By embracing observability, developers and operations teams gain valuable insights into application performance, errors, latency, and other critical aspects, facilitating efficient troubleshooting and optimization.
Micrometer - The Observability Swiss Army Knife
Micrometer is a popular metrics instrumentation library for Java applications. It provides a vendor-neutral abstraction layer for collecting and publishing metrics, allowing developers to easily integrate with different monitoring systems. Spring Boot 2 has excellent support for Micrometer out of the box, making it an ideal choice for implementing observability in your applications. With the introduction of Spring Framework 6 and Spring Boot 3 these functionalities have been further integrated into the Spring ecosystem. The classic approach of using Micrometer is by making it expose endpoints that return information about the requested metric. This means that metrics are requested from the application by aggregation tooling. Examples of these metrics are HTTP metrics like the amount of inbound and outbound requests and jvm metrics like memory utilisation and garbage collection performance. Using these endpoints, one can create dashboards that aggregate this information and give you an overview of the operational state of your entire platform.
Google Cloud Operations - Powerful Monitoring and Observability
The observant reader with some general knowledge of scalable infrastructure, might spot an issue with the usage of endpoints to gather these metrics. When running applications that can scale down to zero instances, contacting these applications to monitor their performance might not be ideal. For example when using GCPs Cloud Run, the amount of running instances is, among others, determined by the amount of HTTP requests sent to the application. When monitoring tooling frequently contacts the application, the application will never scale down to zero instances since the requests for metrics are also traffic it serves. This means that the usage of micrometer would have a major impact on one of the key features modern cloud infrastructure brings: the ability to prevent costs when the system is not used.
One way to fix this issue is to make use of Google Cloud Operations and the micrometer-registry-stackdriver dependency. Google Cloud Operations, formerly called Stackdriver, offers a comprehensive suite of monitoring and observability services. It provides a unified platform for collecting and analyzing metrics, logs, and traces across various GCP services, as well as other supported technologies. By utilizing the micrometer-registry-stackdriver dependency, we can seamlessly integrate our Spring Boot 2 application with Google Cloud Operations, gaining access to its powerful monitoring capabilities. The micrometer-registry-stackdriver dependency makes it possible to send the metric information from the application to GCP instead of the other way around. This does not only allow the applications to scale down to zero instances, but also makes it easy to collect metrics from multiple instances of the same application.
Building our application
To get started, we will need a Spring Boot 2 application and a Google Cloud Platform account. Begin by adding the necessary dependencies to your project’s build configuration. Including the following dependencies to your pom.xml, since we use Maven in this example:
<dependency>
    <groupId>org.springframework.boot</groupId>
    <artifactId>spring-boot-starter-actuator</artifactId>
</dependency>
<dependency>
    <groupId>io.micrometer</groupId>
    <artifactId>micrometer-registry-stackdriver</artifactId>
</dependency>
In this case, no explicit version declaration is needed since I’m using the spring-boot-starter-parent parent project, which comes with a dependency management section containing versions for all supported dependencies.
Once the dependencies are added, we will need to configure our Spring Boot application to publish metrics to the Google Cloud Platform.
In your application’s configuration file (e.g., application.properties), enable stackdriver and reference your GCP project:
management.metrics.export.stackdriver.enabled=true
management.metrics.export.stackdriver.project-id=YOUR_PROJECT_ID
Make sure to replace YOUR_PROJECT_ID with your actual GCP project ID.
On top of this basic configuration we will add a so-called common tag to easily identify our application’s metrics within GCP.
We will do this by making a configuration class called MicrometerStackdriverConfig as follows:
import io.micrometer.stackdriver.StackdriverConfig;
import io.micrometer.stackdriver.StackdriverMeterRegistry;
import org.springframework.beans.factory.annotation.Value;
import org.springframework.context.annotation.Bean;
import org.springframework.context.annotation.Configuration;

@Configuration
public class MicrometerStackdriverConfig {

    @Bean
    StackdriverConfig stackdriverConfig(@Value("${management.metrics.export.stackdriver.project-id}") String projectId) {
        return new StackdriverConfig() {
            @Override
            public String projectId() {
                return projectId;
            }

            @Override
            public String get(String key) {
                return null;
            }
        };
    }

    @Bean
    StackdriverMeterRegistry meterRegistry(StackdriverConfig stackdriverConfig, @Value("${spring.application.name}") String applicationName) {
        StackdriverMeterRegistry stackdriverMeterRegistry = StackdriverMeterRegistry.builder(stackdriverConfig).build();
        stackdriverMeterRegistry.config().commonTags("application", applicationName);
        return stackdriverMeterRegistry;
    }
}
This way the metrics from our application will have a tag with key ‘application’ and the name of our application as value.
With everything set up, our Spring Boot 2 application should now start publishing metrics to GCP when it’s running. This does assume your gcloud CLI is set up correctly and the logged-in user has permissions to publish the metrics. Another option is to deploy the application to the configured GCP project and make sure that the service account that is used to run the applications has permissions to publish the metrics.
In some cases, it is possible that the amount of metrics that Spring Boot tries to send to GCP is too big. If this occurs to you, you can pick the metrics that you would like to publish by setting the following properties to true or false:
management.metrics.enable.tomcat=false
management.metrics.enable.jvm=true
management.metrics.enable.process=false
management.metrics.enable.hikaricp=false
management.metrics.enable.system=true
management.metrics.enable.jdbc=false
management.metrics.enable.http=true
management.metrics.enable.logback=true
management.metrics.enable.spring=true
The source code of a completed example can be found on my GitHub page.
Exploring Observability with Stackdriver:
You can navigate to the GCP Monitoring Console in your GCP project to explore and visualize the collected metrics. From there, you can create custom dashboards, set up alerting policies, and gain insights into your application’s performance and behavior.
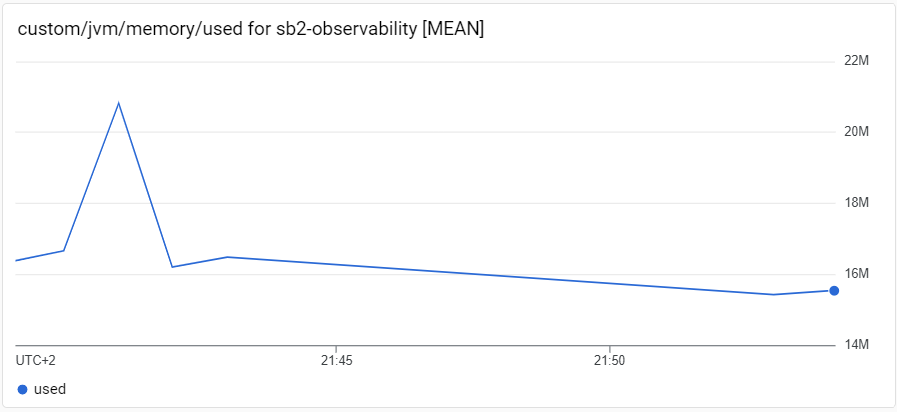
For example, to get an overview of the memory usage of the application we just finished, we can create a dashboard within GCP to show the custom/jvm/memory/used metric:
In addition to metrics, Google Cloud Operations also supports logging and distributed tracing. When applications are deployed in Cloud Run, logging will automatically be collected by Google Cloud Operations. By enabling the appropriate configurations in your Spring Boot application, you can also seamlessly integrate your traces into GCP as well, providing a unified view of your system’s observability.
Conclusion
Achieving observability in your Spring Boot 2 applications is now easier than ever, thanks to the combination of Micrometer and the micrometer-registry-stackdriver dependency. By integrating with Google Cloud Platform’s operations suite, you gain powerful monitoring and observability capabilities, enabling you to identify and resolve issues efficiently without compromising the ability of scaling your platform down. Whether you’re running your applications in a production environment or a development setting, observability is a crucial aspect that can help you deliver high-quality software and ensure smooth operations.
So why wait? Start leveraging the power of Spring Boot 2, Micrometer, and Stackdriver to unlock the full potential of observability in your applications today!